hockey DB
search by league
team
morning report
contact us
home

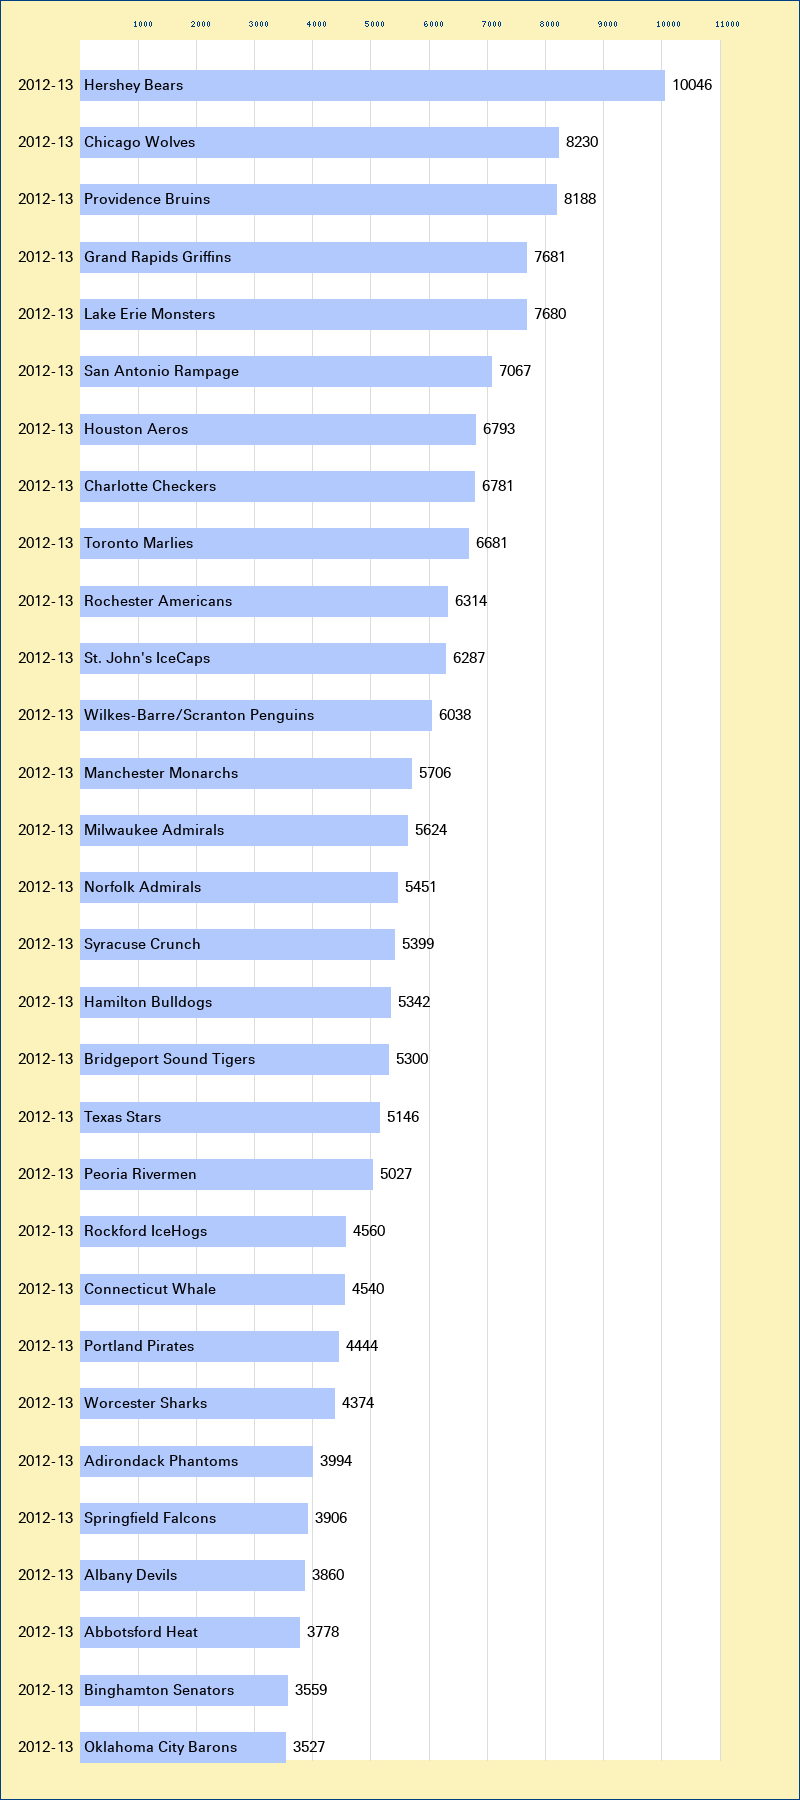
American Hockey League 2012-13 Attendance Graph

This is a graph of the attendance of the American Hockey League for the 2012-13 season. Attendance is based on numbers from a team or league, either released as an official yearly per-game average figure, or compiled into an average from individual boxscore attendance. In some cases when boxscore attendance is unavailable for a small number of games, the attendance is computed omitting the missing games and annotated as approximate. Clicking on a team's bar in the graph will display a graph of that team's attendance across all seasons.
Attendance graph of the AHL for the 2012-13 season
Hershey Bears attendance Chicago Wolves attendance Providence Bruins attendance Grand Rapids Griffins attendance Lake Erie Monsters attendance San Antonio Rampage attendance Houston Aeros attendance Charlotte Checkers attendance Toronto Marlies attendance Rochester Americans attendance St. John's IceCaps attendance Wilkes-Barre/Scranton Penguins attendance Manchester Monarchs attendance Milwaukee Admirals attendance Norfolk Admirals attendance Syracuse Crunch attendance Hamilton Bulldogs attendance Bridgeport Sound Tigers attendance Texas Stars attendance Peoria Rivermen attendance Rockford IceHogs attendance Connecticut Whale attendance Portland Pirates attendance Worcester Sharks attendance Adirondack Phantoms attendance Springfield Falcons attendance Albany Devils attendance Abbotsford Heat attendance Binghamton Senators attendance Oklahoma City Barons attendance