hockey DB
search by league
team
morning report
contact us
home

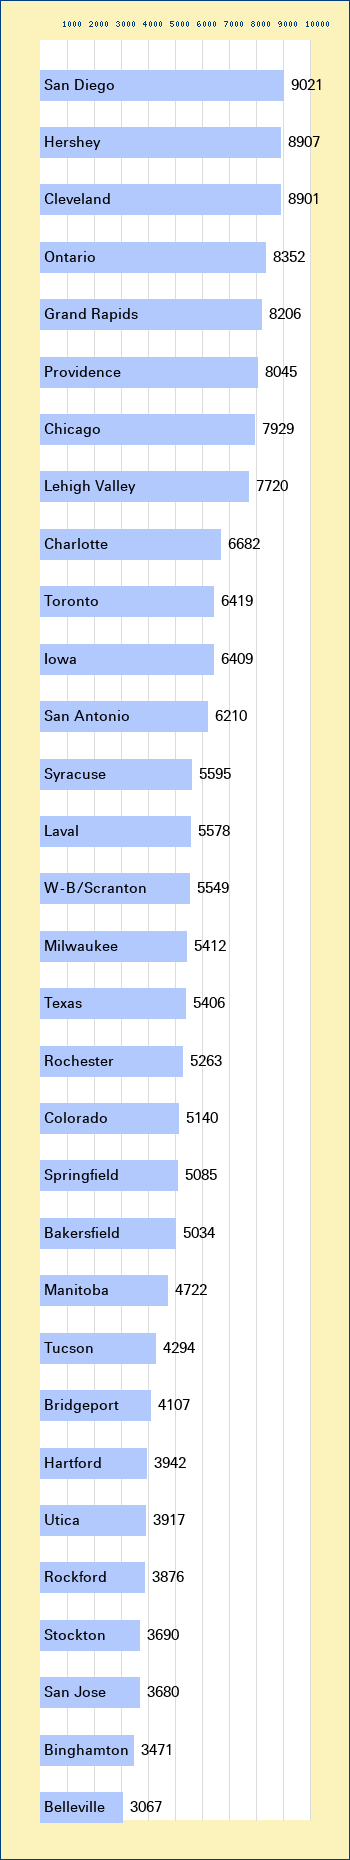
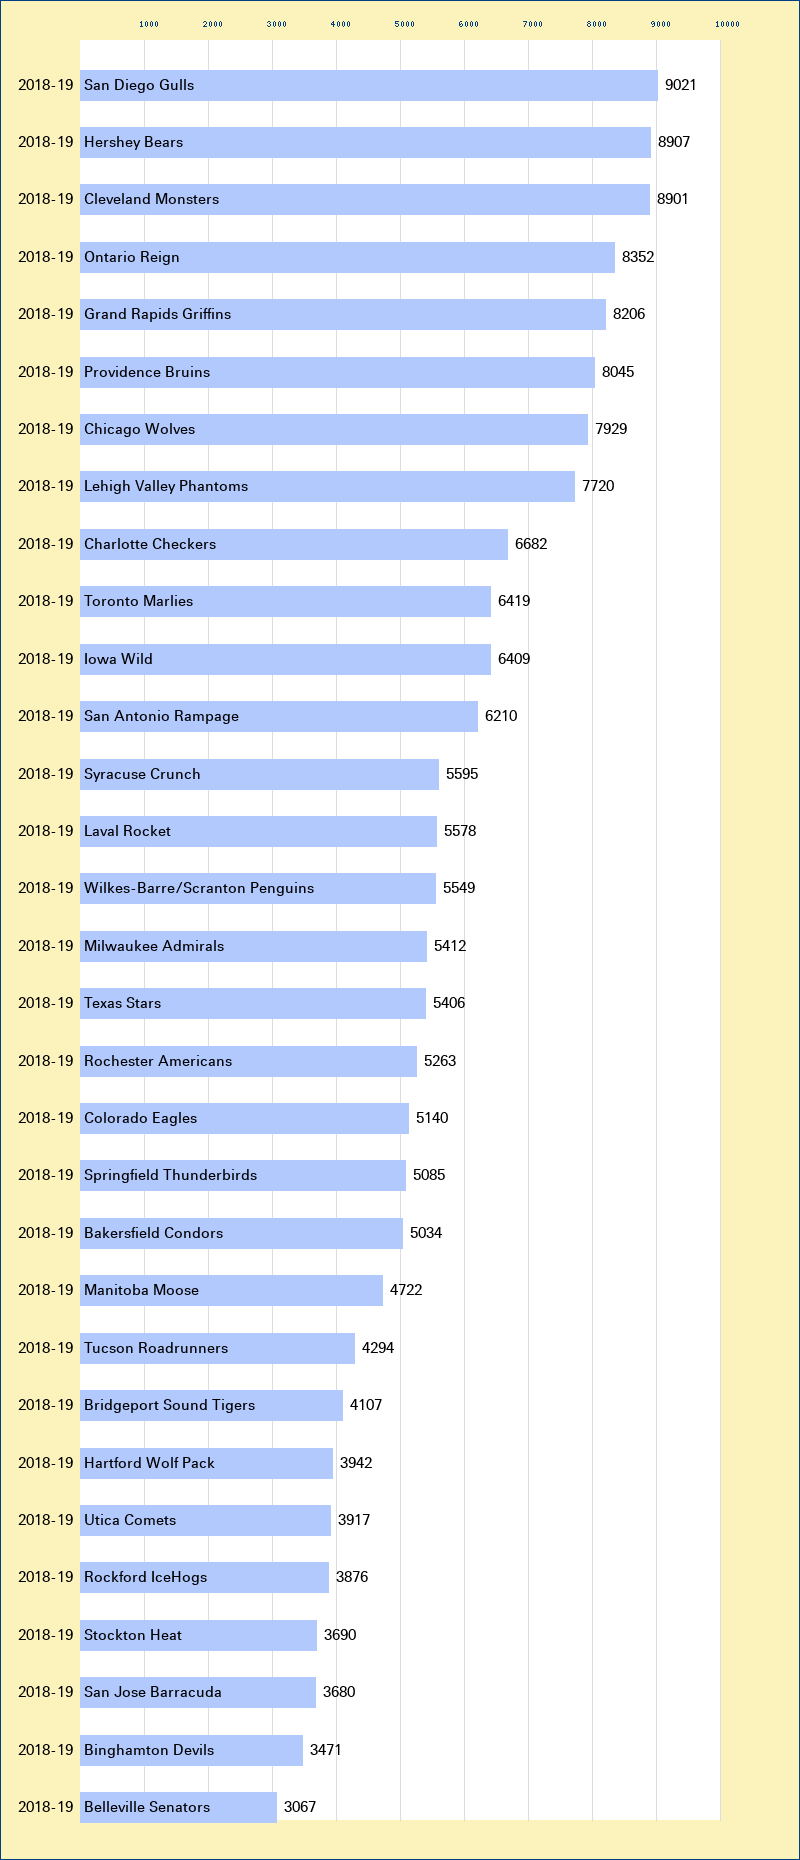
American Hockey League 2018-19 Attendance Graph

This is a graph of the attendance of the American Hockey League for the 2018-19 season. Attendance is based on numbers from a team or league, either released as an official yearly per-game average figure, or compiled into an average from individual boxscore attendance. In some cases when boxscore attendance is unavailable for a small number of games, the attendance is computed omitting the missing games and annotated as approximate. Clicking on a team's bar in the graph will display a graph of that team's attendance across all seasons.
Attendance graph of the AHL for the 2018-19 season
San Diego Gulls attendance Hershey Bears attendance Cleveland Monsters attendance Ontario Reign attendance Grand Rapids Griffins attendance Providence Bruins attendance Chicago Wolves attendance Lehigh Valley Phantoms attendance Charlotte Checkers attendance Toronto Marlies attendance Iowa Wild attendance San Antonio Rampage attendance Syracuse Crunch attendance Laval Rocket attendance Wilkes-Barre/Scranton Penguins attendance Milwaukee Admirals attendance Texas Stars attendance Rochester Americans attendance Colorado Eagles attendance Springfield Thunderbirds attendance Bakersfield Condors attendance Manitoba Moose attendance Tucson Roadrunners attendance Bridgeport Sound Tigers attendance Hartford Wolf Pack attendance Utica Comets attendance Rockford IceHogs attendance Stockton Heat attendance San Jose Barracuda attendance Binghamton Devils attendance Belleville Senators attendance