hockey DB
search by league
team
morning report
contact us
home

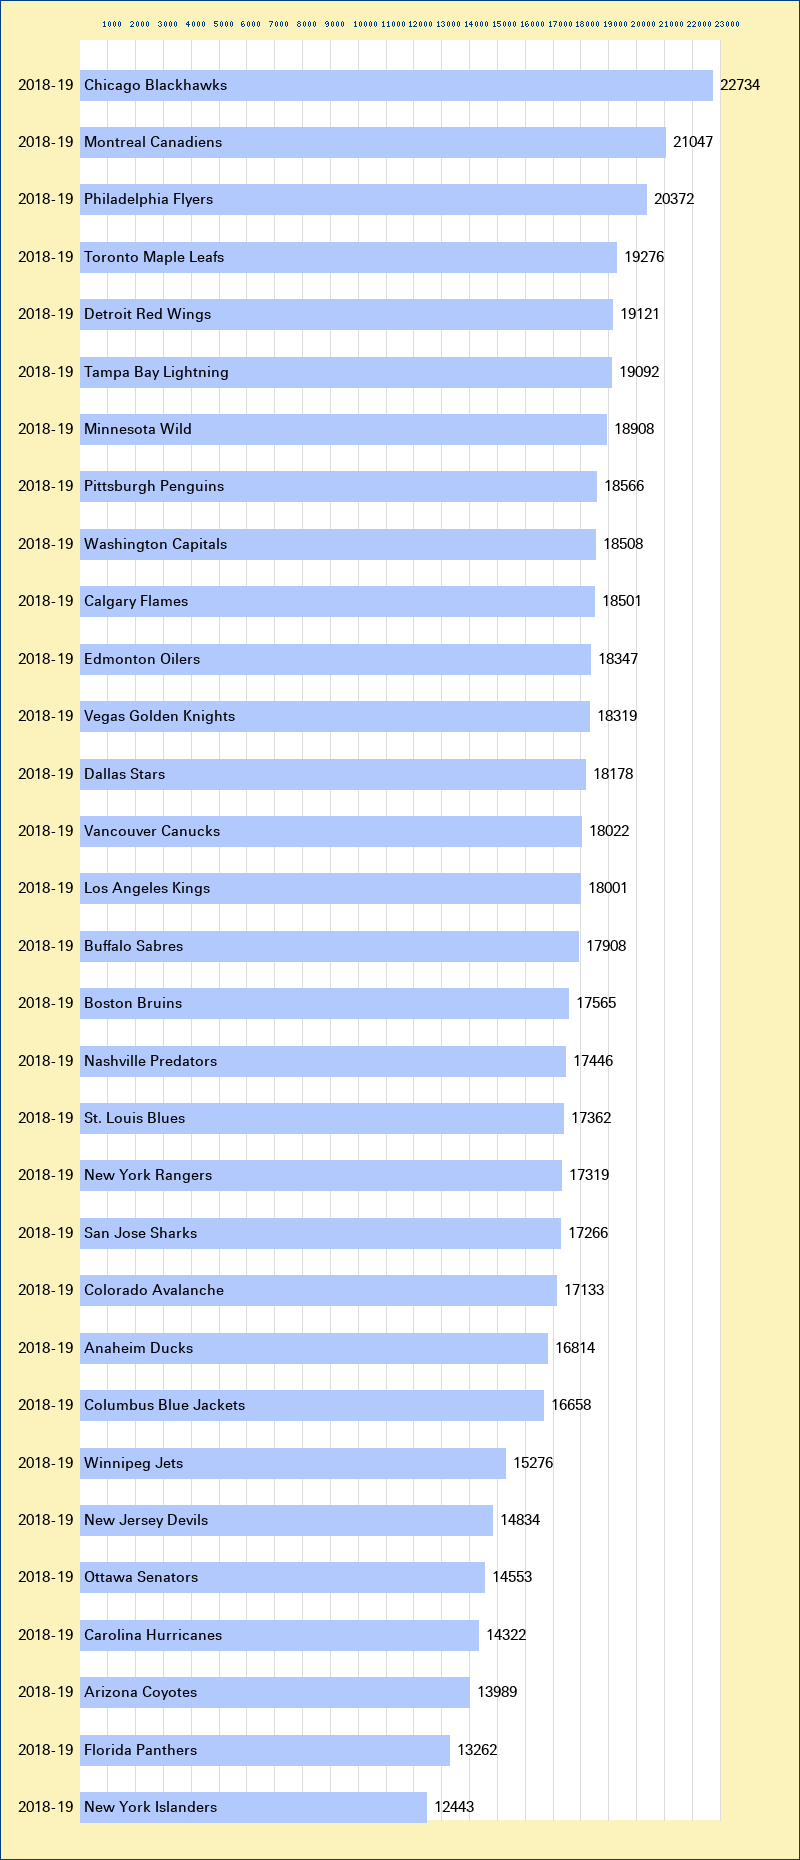
National Hockey League 2018-19 Attendance Graph

This is a graph of the attendance of the National Hockey League for the 2018-19 season. Attendance is based on numbers from a team or league, either released as an official yearly per-game average figure, or compiled into an average from individual boxscore attendance. In some cases when boxscore attendance is unavailable for a small number of games, the attendance is computed omitting the missing games and annotated as approximate. Clicking on a team's bar in the graph will display a graph of that team's attendance across all seasons.
Attendance graph of the NHL for the 2018-19 season
Chicago Blackhawks attendance Montreal Canadiens attendance Philadelphia Flyers attendance Toronto Maple Leafs attendance Detroit Red Wings attendance Tampa Bay Lightning attendance Minnesota Wild attendance Pittsburgh Penguins attendance Washington Capitals attendance Calgary Flames attendance Edmonton Oilers attendance Vegas Golden Knights attendance Dallas Stars attendance Vancouver Canucks attendance Los Angeles Kings attendance Buffalo Sabres attendance Boston Bruins attendance Nashville Predators attendance St. Louis Blues attendance New York Rangers attendance San Jose Sharks attendance Colorado Avalanche attendance Anaheim Ducks attendance Columbus Blue Jackets attendance Winnipeg Jets attendance New Jersey Devils attendance Ottawa Senators attendance Carolina Hurricanes attendance Arizona Coyotes attendance Florida Panthers attendance New York Islanders attendance